
Why does it take so long to find the equipment behind an alert?
A PDU circuit crossing 80 percent names a circuit, not a device. When the floor plan, the asset register and the power readings live in separate systems, closing that gap is the slowest part of the shift. Here is what changes when they share one model of your infrastructure.
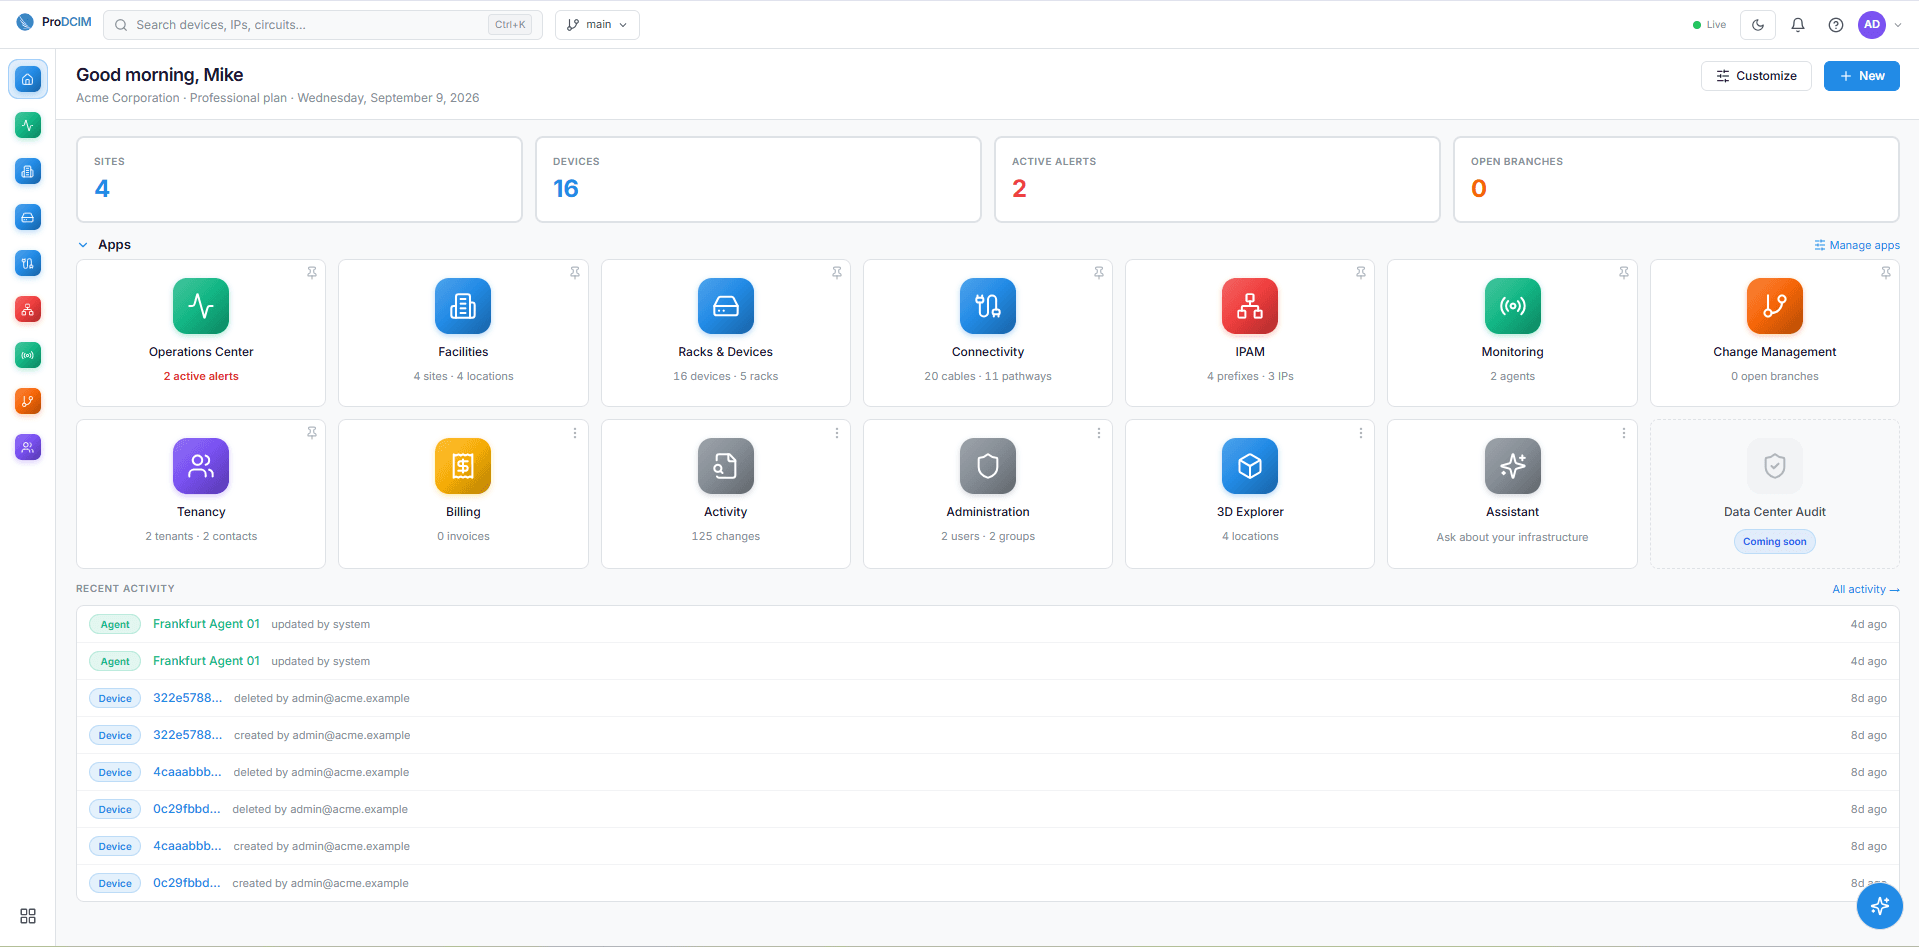
When monitoring, asset records and floor plans live in separate systems, every alert turns into a search. An integrated DCIM platform keeps them in one model, so you can go from an alarm to the rack, the device and its history without leaving the screen.
That is what we built ProDCIM to do. It is a suite of around 20 modules, covering digital monitoring, 2D floor plans and asset lifecycle management, and they all read from the same picture of your infrastructure.

Every module is a work area, and each tile carries its own live counts: four sites, sixteen devices, two active alerts. Product screenshot with sample data; Data Center Audit is marked coming soon.
Why does a simple power alarm take so long?
A PDU circuit crosses its utilization threshold. Before anyone can act, someone has to work out which rack that circuit feeds, what is drawing from it, and what changed recently.
If the floor plan is in one tool, the asset register in another and the maintenance history in a third, that is three logins and a phone call before the real work starts. The alarm was the easy part. Assembling the context is what costs the shift.
It helps to know what the number actually means. Under NFPA 70, the National Electrical Code, a continuous load should not exceed 80 percent of a branch circuit's rating. That is why a circuit sitting at 71 percent is comfortable, and the same circuit at 84 percent is a problem you wanted to see coming. An alarm is only useful if you can tell quickly which rack is drifting toward that line, and what put it there.
What does the same investigation look like when the data is connected?
Take that alarm again, and say it appeared soon after new equipment went in.
In ProDCIM you start at the alert. A 2D floor plan shows you the rack. The asset view lists every device fed by that circuit, which turns an unknown into a short list of candidates. Power readings show what changed and when, against the headroom the rack had before. If 3D visualization is turned on, you can see how that rack's draw compares with the rest of the row.
None of that is a jump between systems, because the rack on the floor plan is the same rack the asset records and the readings belong to. You stay on one thread.
A short list is not the same as an answer, and it is worth being precise about the difference. The asset view tells you what is connected to that circuit. It does not tell you which of those devices moved. Naming the one that took the circuit to 84 percent means reading per-device power telemetry where you have it, or checking what was installed, re-tasked or brought back into service that week.
That is still the whole point. You are working through a handful of known candidates instead of hunting the floor.
If you have the workflow integration set up, the event can go straight into your ticketing process. You pass what you found to the technician, they record the work, and you check the next readings to see whether the load came back down.
What about the work that is not an incident?
Most days are not incidents. They are moves, installs and replacements, and that is where records quietly go wrong. A server that moves without its record being updated is the reason the next investigation takes an hour instead of ten minutes.
ProDCIM keeps equipment identity, location, owner and lifecycle status in one register, and holds on to the change history. Before you add a server, you can look at rack space and power headroom together. When you plan a replacement, you can see what has already happened to that asset.
This only works if the register is kept current and each monitoring point is mapped to the right device. That is real work, and it is fairer to say so than to pretend the platform does it by itself.
Will it work with the equipment we already have?
Usually, yes. Data centers are full of equipment from different makers, bought at different times, sitting next to building management and service desk tools that are not going anywhere.
ProDCIM collects over SNMP, Modbus, BACnet and MQTT. Our own sensors and data acquisition gateways bring readings off the floor and into the platform, which matters most at remote sites where nobody is standing in the room.
Above the floor, ProDCIM exposes its assets, sites and metrics through token-secured REST endpoints, with webhooks that push events the moment they happen rather than waiting to be polled. Tokens are scoped and revocable per integration, so the system of record you connect, whether that is your ITSM queue, a BMS or a cloud platform, reads only what you grant it.
We scope each integration around the actual equipment, interfaces and workflow involved, rather than promising one connector that fits everything.
What does the AI Companion actually do?
You ask it questions in plain language. Summarize this site. Are these two alarms related. Where do I still have capacity.
It answers from the platform's own infrastructure data, and it points you at the equipment and readings behind the answer so you can check its work. That last part is the one that matters: you decide what to do, not the model.
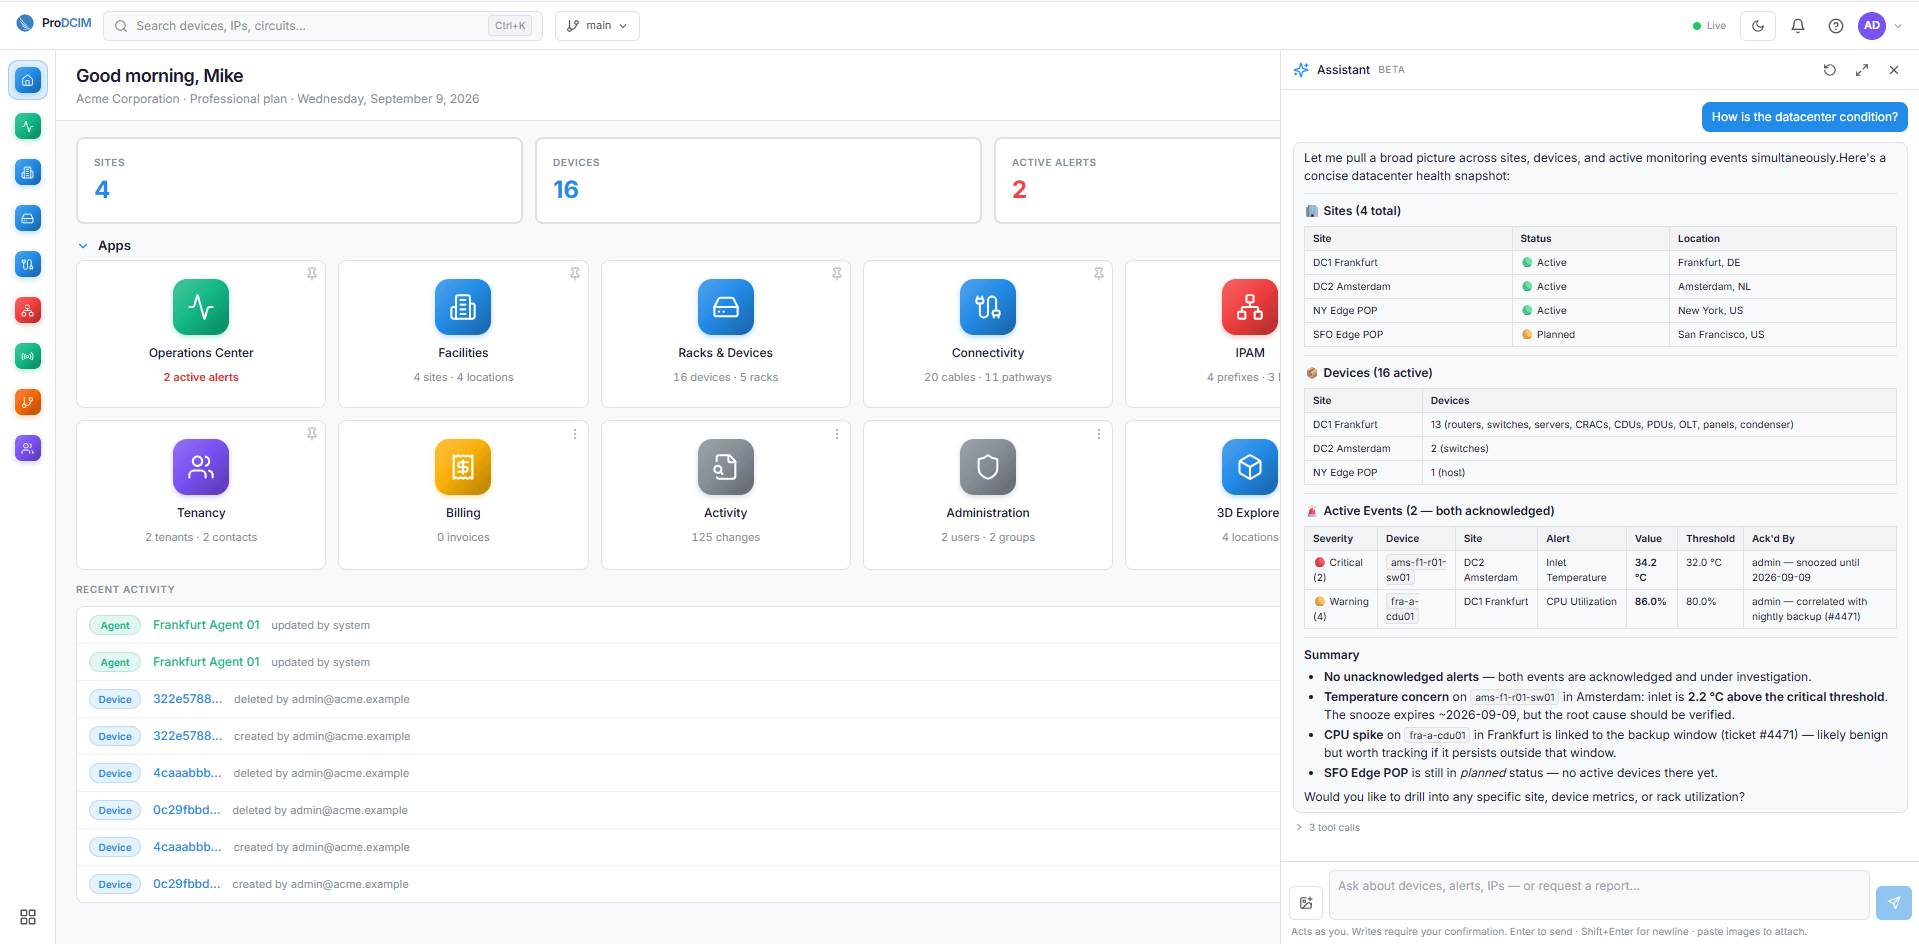
Asked how the datacenter is doing, the Assistant answers from the platform's own records and shows its working: which sites, which devices, and both active events with what each is waiting on. Product screenshot with sample data.
ProDCIM runs on-premises or in the cloud, and local AI processing is available when your data cannot leave the building. That includes isolated environments.
Where should a team start?
Somewhere specific.
One team needs an inventory it can trust and a floor plan. Another cannot explain its energy use. Another keeps seeing the same alarm and never gets to the bottom of it. Because the platform is modular, your first deployment can be exactly that, with more added when there is a reason to add it.
A common path is asset management and monitoring first, then visualization, deeper analysis, or workflow integration.
The honest test is whether daily work gets easier. How long does it take you to name the equipment behind an alert? How often do two records disagree? Can the next shift see what happened without asking anyone? Uptime Institute's Global Data Center Survey makes the same point from the other direction: power problems remain one of the most common causes of significant outages, and the damage usually has less to do with the fault itself than with how long it took to understand it.
Better records are not paperwork. They are how the next incident goes faster.
The short version
A power alarm names a circuit, not a device. Everything between those two facts is time, and most of that time is spent moving between systems that do not share a model of your infrastructure. Connect the floor plan, the asset register and the readings, and the same alarm becomes a short list of candidates instead of a search.
Bring us one problem that keeps coming back. We will walk through it with you, work out which modules are relevant, and set up a focused proof of concept around the result you want to see.
Sources: NFPA 70, National Electrical Code, Articles 210.19 and 210.20, branch circuit conductor sizing and continuous load. Uptime Institute, Global Data Center Survey. Screenshots are ProDCIM product views using sample data.
See it on your own racks
Book a walkthrough mapped to your environment: monitoring, asset management and out-of-band resilience across every site.
More insights
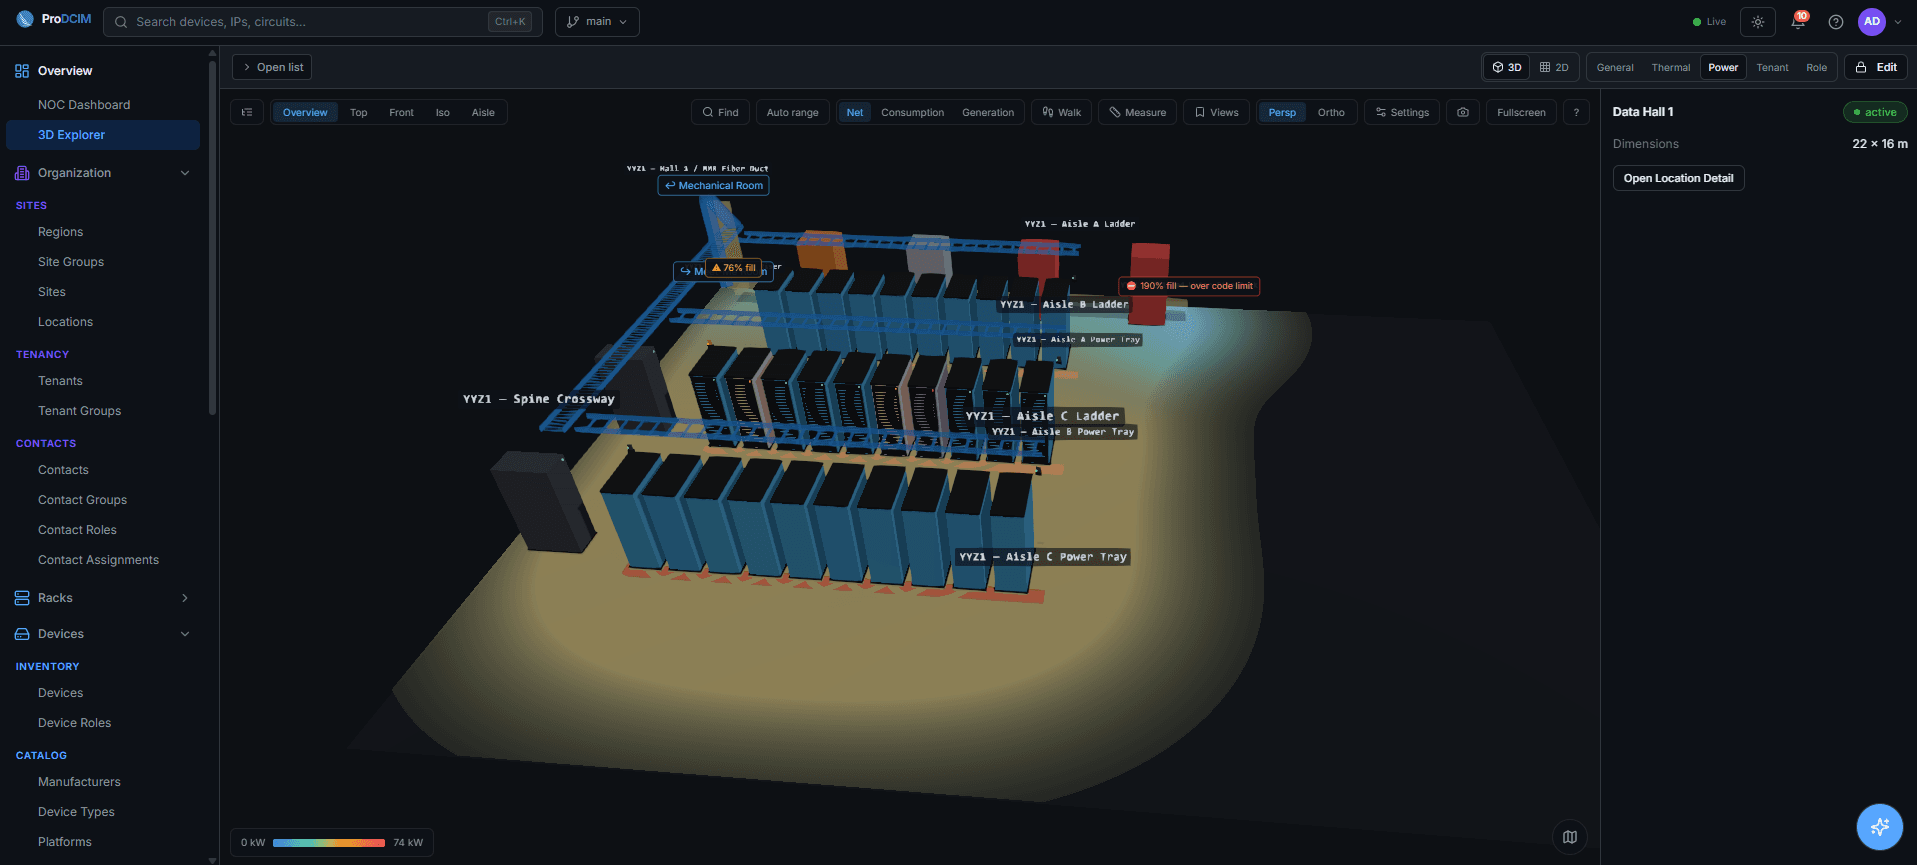
Racks Are Getting Denser. Confidence in the Data Is Not.
Uptime Institute's 2026 survey shows racks at 50 kW or more rose from 10 to 13 percent in a year, while racks under 10 kW fell from 32 to 25 percent. Over the same period operators reported the least confidence in the completeness of their operational data, which is the property that decides whether you can act on it.
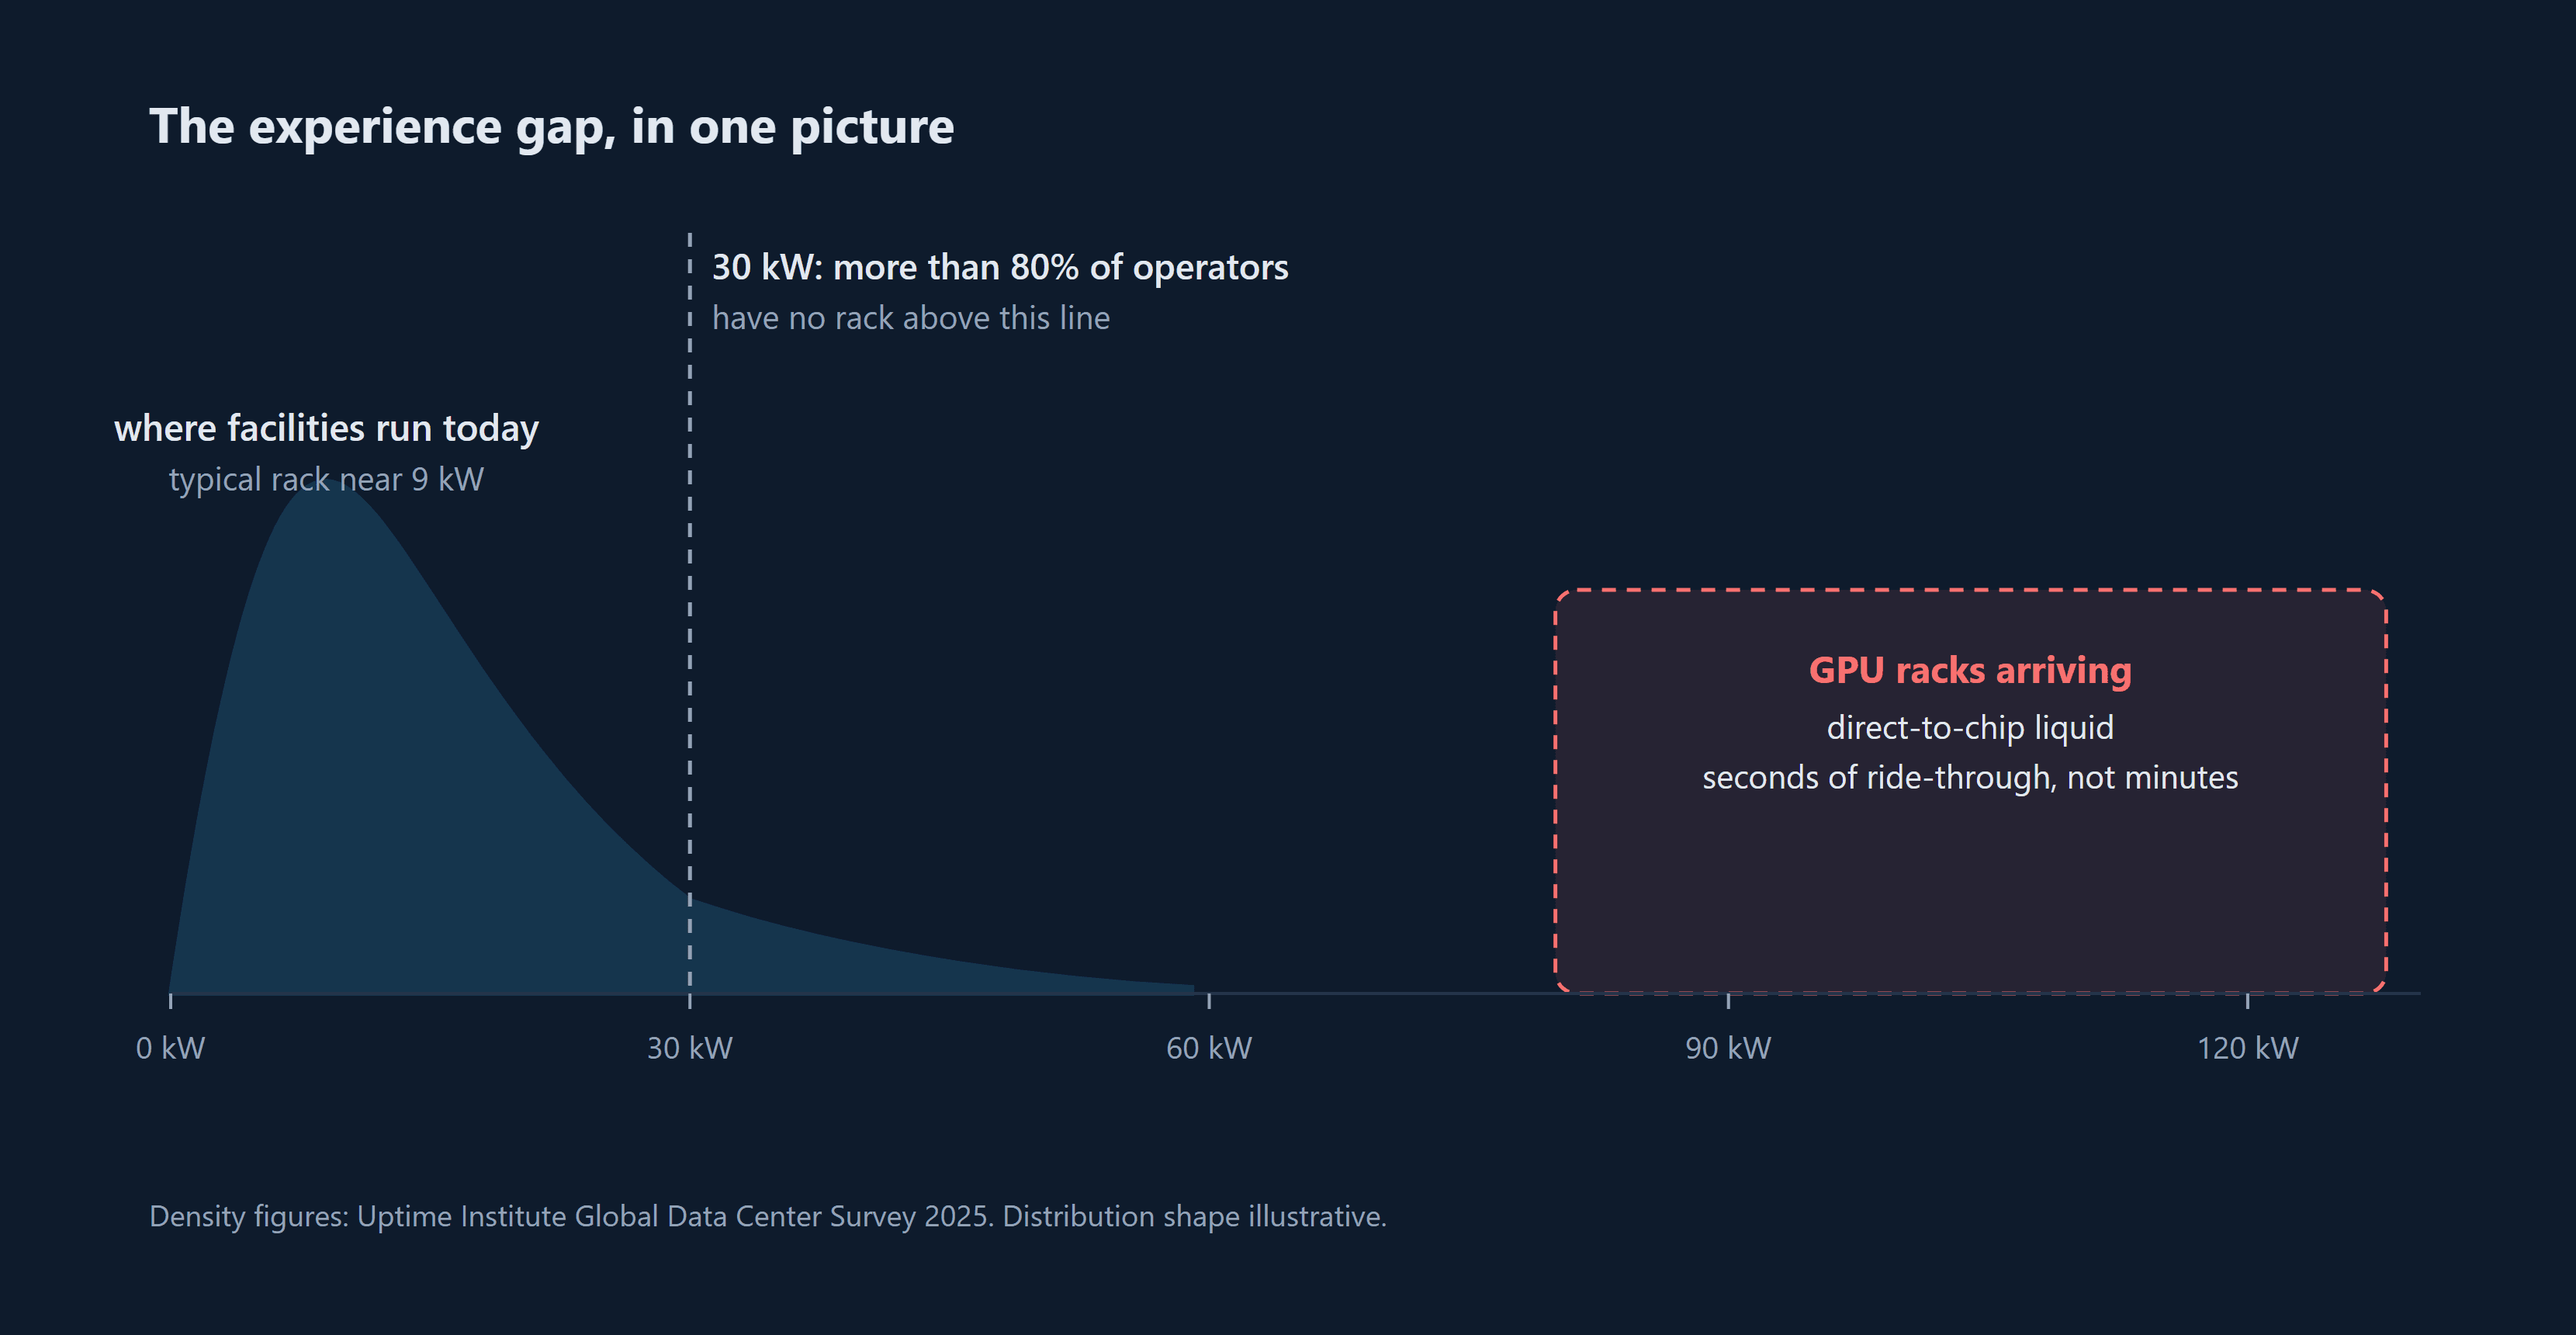
Liquid Cooling Is Arriving Faster Than the Skills to Run It
More than 80 percent of operators have never run a rack above 30 kW, and the typical facility rack sits near 9 kW. The GPU loads arriving now run far hotter, on pumped liquid, with seconds of thermal ride-through instead of minutes. The hardware will arrive on schedule. Here is the four week program that gets the team ready before it does.
Nameplate vs. Reality: How Data Centers Can Reclaim Stranded Power
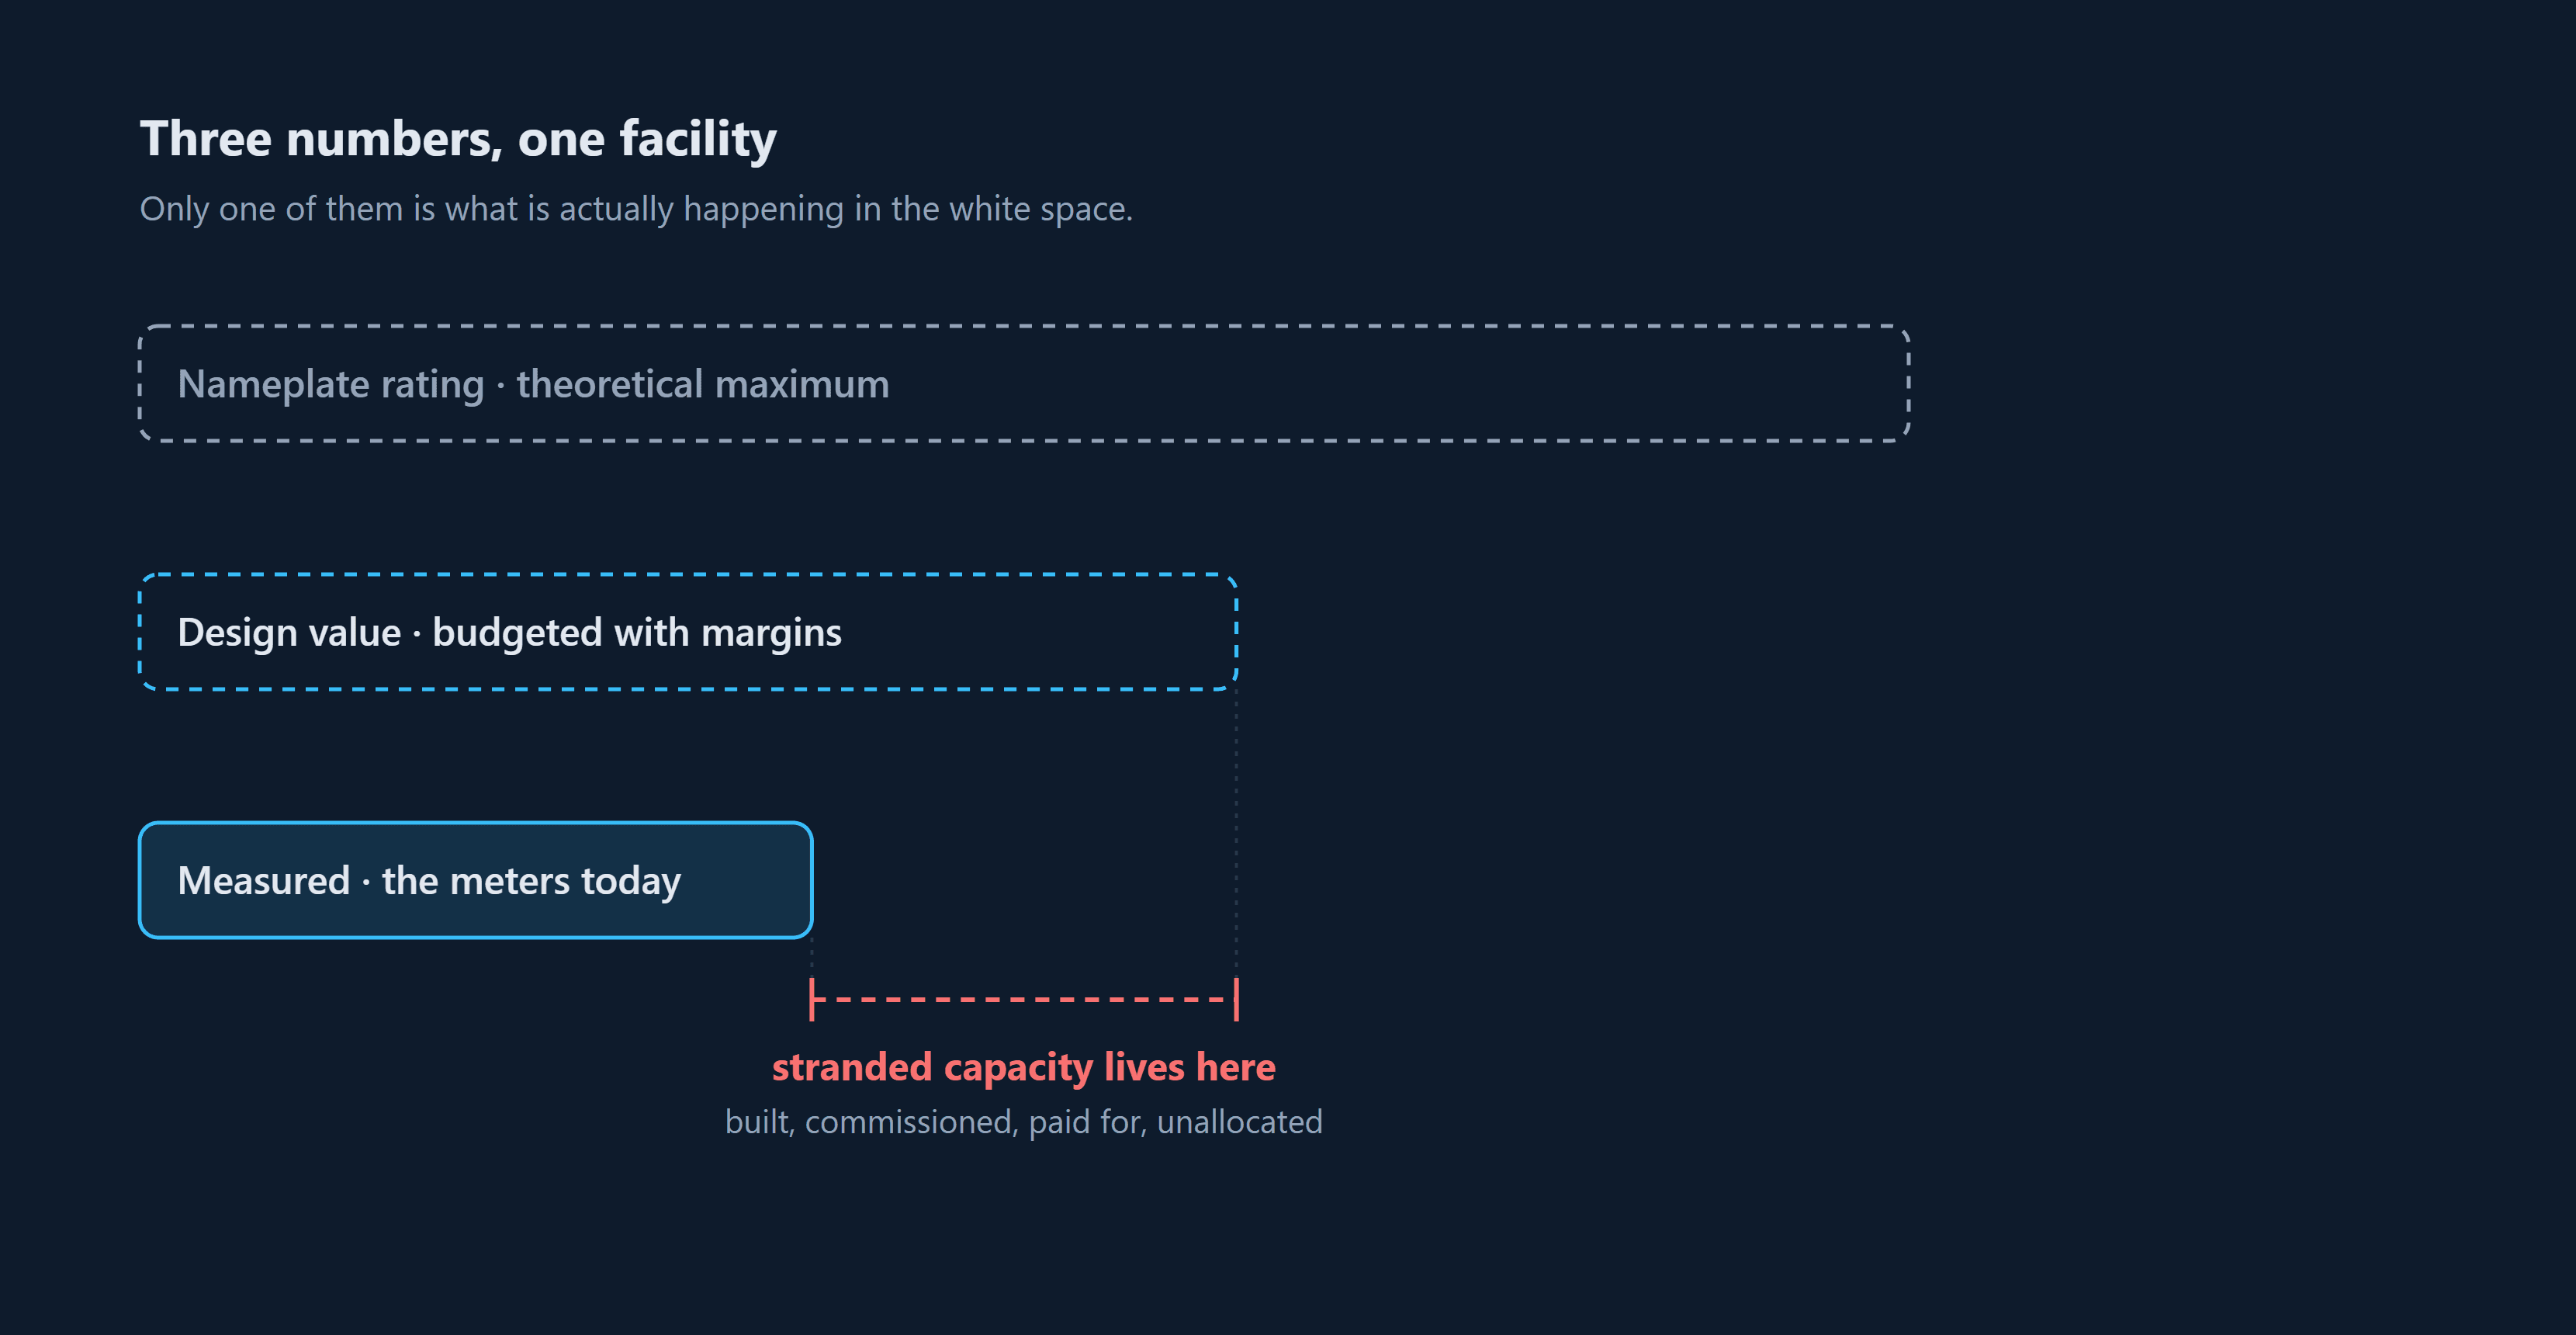
Most data centers have more usable power than their spreadsheets admit. It sits stranded between conservative design assumptions and what the meters actually show. Reclaiming it takes measurement, not retrofits: branch-circuit telemetry, high-percentile planning baselines, and headroom modeled under N-1. Here is the playbook.